Welcome back to the AI Bayeslab Statistics series.
Introduction: Foundations of Variance Inference
This discussion is a conceptual foundation for inferring population variance from sample variance and population proportion from sample proportion. Let's conduct a historical conceptual review and a concise comparative analysis.
In the template "Overview - The ABCs of Statistics," we previously discussed several distributions. We briefly covered Chi-Squared (X²) Distribution and F-Distributions. Now, let's examine these topics more thoroughly.
The focus is mainly on sample variance, which influences parameter estimation and hypothesis testing regarding population variance.
Before, all we discussed was t-testing for sample means in hypothesis testing.
The distributions associated with sample variance are the chi-squared (X²) and F distributions.
The X² distribution describes the sampling distribution of two sample variances.
The F distribution describes the sampling distribution of the ratio of two sample variances.
The sampling distribution of sample variance aids in interval estimation and hypothesis testing for population variance and variance homogeneity, which is essential for statistical tests.
Previously in t-test, we noted that when the population variance is unknown, the choice of test statistics and the calculation of degrees of freedom vary significantly depending on variance homogeneity. For more details, refer to the historical template discussed earlier, summarized as follows:

Comparing Two Population Means (Unknown Variances)
Homogeneity of variance / Homoscedasticity
Definition: The property that different groups or samples have equal population variances.
Example: "Before performing an independent samples t-test, you must check for homogeneity of variance."
Heterogeneity of variance / Heteroscedasticity

Definition: The condition where different groups or samples have unequal population variances.
Example: "When heterogeneity of variance is present, you should use Welch's adjusted t-test."
3.Key Distributions for Variance Analysis
3.1 Chi-Squared (χ²) Distribution

Describes the sampling distribution of sample variance.
Used for:
Testing if a sample variance matches a hypothesized population variance (χ² test).
Goodness-of-fit tests (e.g., checking if observed frequencies match expected ones).
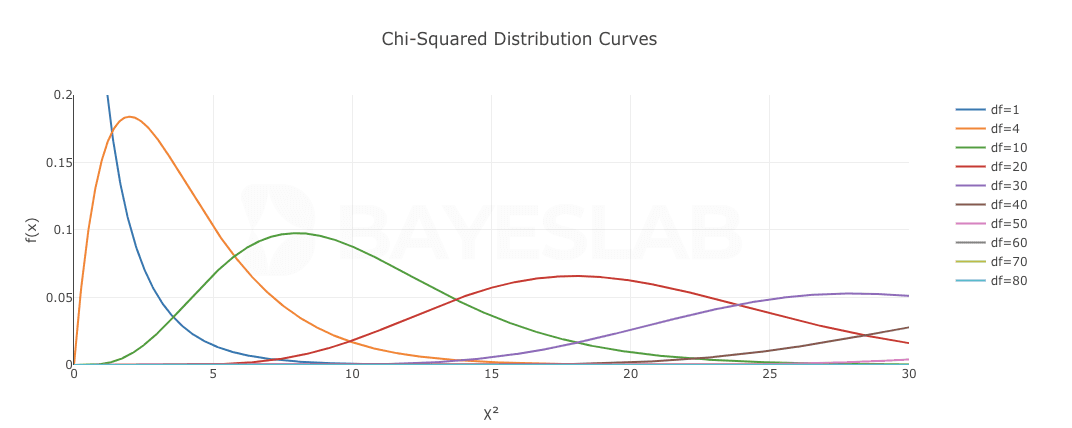
The probability of the Chi-Squared distribution is determined by n = df(n), which represents the degrees of freedom and the number of independent variables that can vary freely in statistical calculations.
The mean of the Chi-Squared distribution is E(X) = n. The variance of the Chi-Squared distribution is D(X) = 2n. Therefore, as n approaches infinity( n→∞), X² approaches N(n, 2n).
Additionally, the Chi-Squared distribution is additive. In other words, if X₁ ~ X²₍𝑑𝑓₁₎ and X₂ ~ X²₍𝑑𝑓₂₎, then (X₁ + X₂) ~ X²₍𝑑𝑓₁₊𝑑𝑓₂₎.
3.2 F-Distribution

Describes the ratio of two sample variances.
Used for:
Comparing variances from two populations (F-test for equality of variances).
ANOVA (Analysis of Variance) to test differences among group means.
If X₁ ~X²₍𝑑𝑓₁₎ and X₂~X²₍𝑑𝑓₂₎, and ( X₁ ) and ( X₂ ) are independent, then the random variable F(x) can be expressed as:
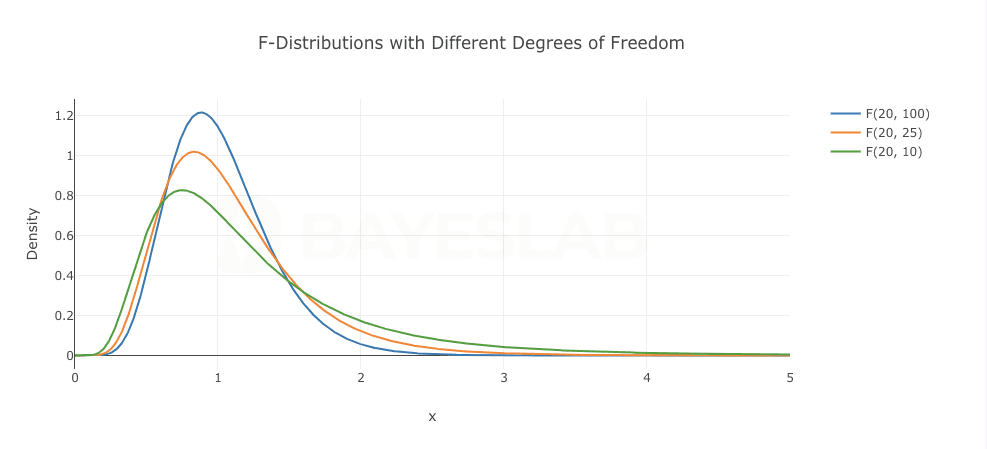
The F-distribution is determined by two parameters, namely the degrees of freedom ( df₁ ) and ( df₂ ). Each pair of ( df₁ ) and ( df₂ ) defines an F-distribution.
When ( df₁ ≤ 2 ), the F-distribution density function is J-shaped.
When ( df₁ > 2 ), the F-distribution density function is bell-shaped.
As ( df₁ ) and ( df₂ ) increase, the skewness of the curve decreases, but it does not approach the limit form of a normal distribution.
4.Practical Business Problems & Applications
Here are several concrete real-world business problems that illustrate the application of Chi-Squared (χ²) Distribution and F-Distribution in statistical inference:
1. Quality Control in Manufacturing
A factory historically produces bolts with a length variance of σ² = 0.04 mm². A new sample of 30 bolts yields a sample variance of s² = 0.09 mm². Can we conclude that the production process has become less consistent? (One-tailed χ² test: H₀: σ² ≤ 0.04 vs. H₁: σ² > 0.04)
2. Pharmaceutical Drug Comparison
Two blood pressure medications (Drug A and Drug B) are tested on 50 patients each. Drug A shows a variance in effectiveness (s₁² = 25), while Drug B shows s₂² = 36. Is there a statistically significant difference in the consistency of their effects? (F-test for variance equality: H₀: σ₁² = σ₂² vs. H₁: σ₁² ≠ σ₂²)
3. Production Line Consistency Check
A factory has two production lines (A and B) making the same type of battery. A sample of 30 batteries from Line A shows a lifespan variance of 8 hours², while a sample of 25 from Line B shows a variance of 12 hours². Do the two production lines have the same variability in battery lifespan? (F-test for homogeneity of variances)
4. Market Research Reliability Assessment
A company surveys customer satisfaction in two regions (Region X: n=100, p̂₁=65%; Region Y: n=100, p̂₂=58%). Before comparing the proportions, we need to check if the variances in satisfaction levels are equal to justify pooling the data. (Variance homogeneity test for proportions)
5. Evaluating Education Policy Impact
A new teaching method is tested in 10 classrooms. Before implementation, exam score variance was s₁² = 120; afterwards, it was s₂² = 75. Did the new method significantly reduce score variability? (One-tailed F-test: H₀: σ₁² ≤ σ₂² vs. H₁: σ₁² > σ₂²)
6. Clinical Trial Precision Analysis
Two glucose measurement methods (A and B) are compared. Method A has a measurement variance of 0.81 (mmol/L)², while Method B has 0.49 (mmol/L)². Is Method B truly more precise, or is the difference due to random variation? (F-test for comparing measurement precision)
These problems involve inferring population variance from sample variance or comparing variances—key applications of the χ² and F-distributions in hypothesis testing and statistical decision-making.
5.Conclusion: When to Use χ² vs. F-Tests
Use χ² when testing a single sample variance against a known value.
Use the F-test when comparing two sample variances.
Both are essential for quality control, clinical trials, market research, and policy evaluation.
This guide connects theory with practice, enabling you to assess your business like analysts accurately use χ² and F-distributions in real-world situations.
Stay tuned, subscribe to Bayeslab, and let everyone master the wisdom of statistics at a low cost with the AI Agent Online tool.