Building on our previous detailed introduction to descriptive statistics, we now formally begin to introduce inferential statistics, which we have previously defined as follows:
Statistical inference:
The study of how to infer information about a population based on sample data using probability theory. It mainly includes two forms: parameter estimation and hypothesis testing.
In today’s installment, we will first delve into parameter estimation. We will start by understanding the definition and objectives of parameter estimation. Then, we will work step-by-step through a specific example involving the estimation of the average sales parameter for a coffee shop’s sales data. Finally, we will reinforce the parameter analysis by incorporating related concepts and definitions through practical examples.
Throughout this process, we will use the Bayeslab online AI analysis tool. With the help of AI Agent’s visualization capabilities, we can obtain Python analytical code tailored by the AI Agent with just simple prompts. This approach enables us to efficiently perform Python data visualization and routine business analysis.

The outcome includes not only a set of visualized images but also Python source code, data analysis files, and even assists individuals with no statistical or Python coding background to complete professional data analysis. Let’s begin.
what is parameter estimation?
Parameter analysis involves using the sample mean to estimate the population mean, the sample proportion to estimate the population proportion, and the sample variance to estimate the population variance.
Parameter estimation is the process of using sample data to determine the values of parameters in a statistical model. These parameters represent characteristics of a population, such as the mean or standard deviation. The statistic concepts involved in this process will be summarized at the end of this installment.
What is the goal of parameter estimation?
The goal of parameter estimation is to make inferences about the population based on the observed sample data, leading to informed decisions or predictions.
What is an example of a parameter estimate?
Here, we introduce parameter estimation using a concrete business data analysis case, which involves studying the average daily sales of a coffee shop in a specific region. The specific steps involved in this data analysis case are:
Step1. Data Collection: Collect the daily sales data from the past 30 days. The data is already prepared and available in the file “coffee_shop_sales_data.csv” on the left side.
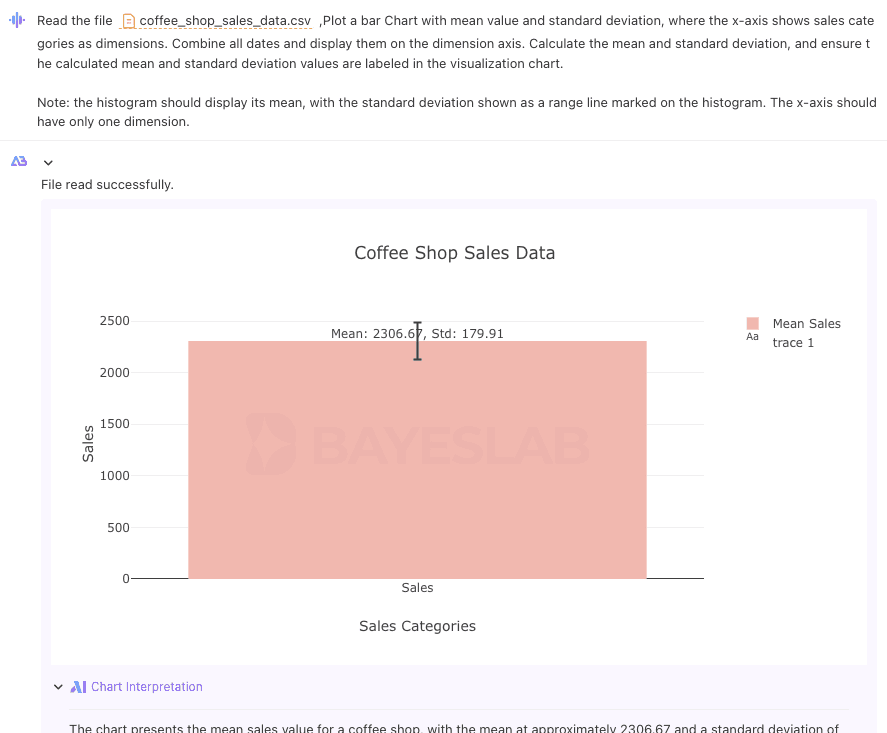
Step2. Calculation: Calculate Sample Mean and Sample Standard Deviation.
Step3. Point Estimation: Use the data calculated above to estimate the population mean.
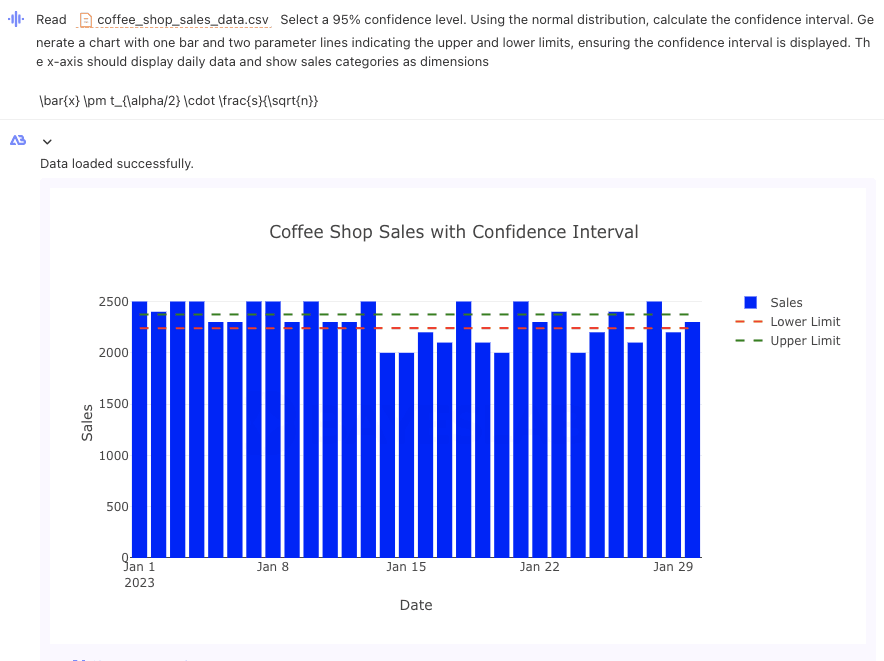
Step4. Interval Estimation: Choose an appropriate confidence interval and data distribution to calculate the confidence interval.
Step5. Business Analysis Summary.
This detailed analysis helps the coffee shop make more reliable sales forecasts and operational decisions based on data. Through this classic and simple business data analysis case, we can gain a comprehensive understanding of what parameter estimation is.
Step1. Data Collection
The data used here was actually generated directly using a prompt. If you’re interested, you can give it a try. The content is already stored in the “coffee_shop_sales_data.csv” file
Here, we use 30 days of sales data. With 30 or more samples, we generally refer to it as a large sample.
We can refer to the sampling distribution of sample means when different sample sizes are taken from the population.
Let’s examine the following distribution types: normal distribution, uniform distribution, bimodal distribution, and exponential distribution.
For sample sizes, we will use ( n = 2, 5, 30 ).
We can observe that regardless of the type of distribution, when the sample size is 30, the distribution shape becomes very close to a normal distribution.
Therefore, the normal distribution is very important in data analysis. For a detailed introduction to the normal distribution, you can refer to our previous template introduction:
▪︎ ABCs of Statistics (2.1) — Normal Distribution Curve_1
▪︎ ABCs of Statistics (2.2) — Normal Distribution Curve_2
▪︎ ABCs of Statistics (2.3) — Normal Distribution Curve_3
In case the sample size is less than 30, we can use the t-distribution as a small sample. This involves degrees of freedom, which we will discuss in detail later.


Step2. Calculation
Calculate the sample mean and sample standard deviation:
Sample mean X̅ : Take the average of all daily sales.
Sample standard deviation( s ): Measures the dispersion of the data.
The result be calculated by the AI Agent :
▶︎ Mean : X̅ = $2306.7
▶︎ Standard deviation s = $179.90


Step3. Point Estimation
Use the sample mean of $2306.7 as the point estimate for the population mean.
▶︎ Estimator: Sample mean
▶︎ Estimated Value: $2306.7
Step4. Interval Estimation
95% Confidence Interval: [2239.49, 2373.85]

Step5. Business Analysis Summary
▶︎ Point Estimate: The point estimate of the average daily sales is $2306.7.
▶︎ Interval Estimate: At a 95% confidence level, the average daily sales of the coffee shop are likely to be between $2239.49 and $2373.85.
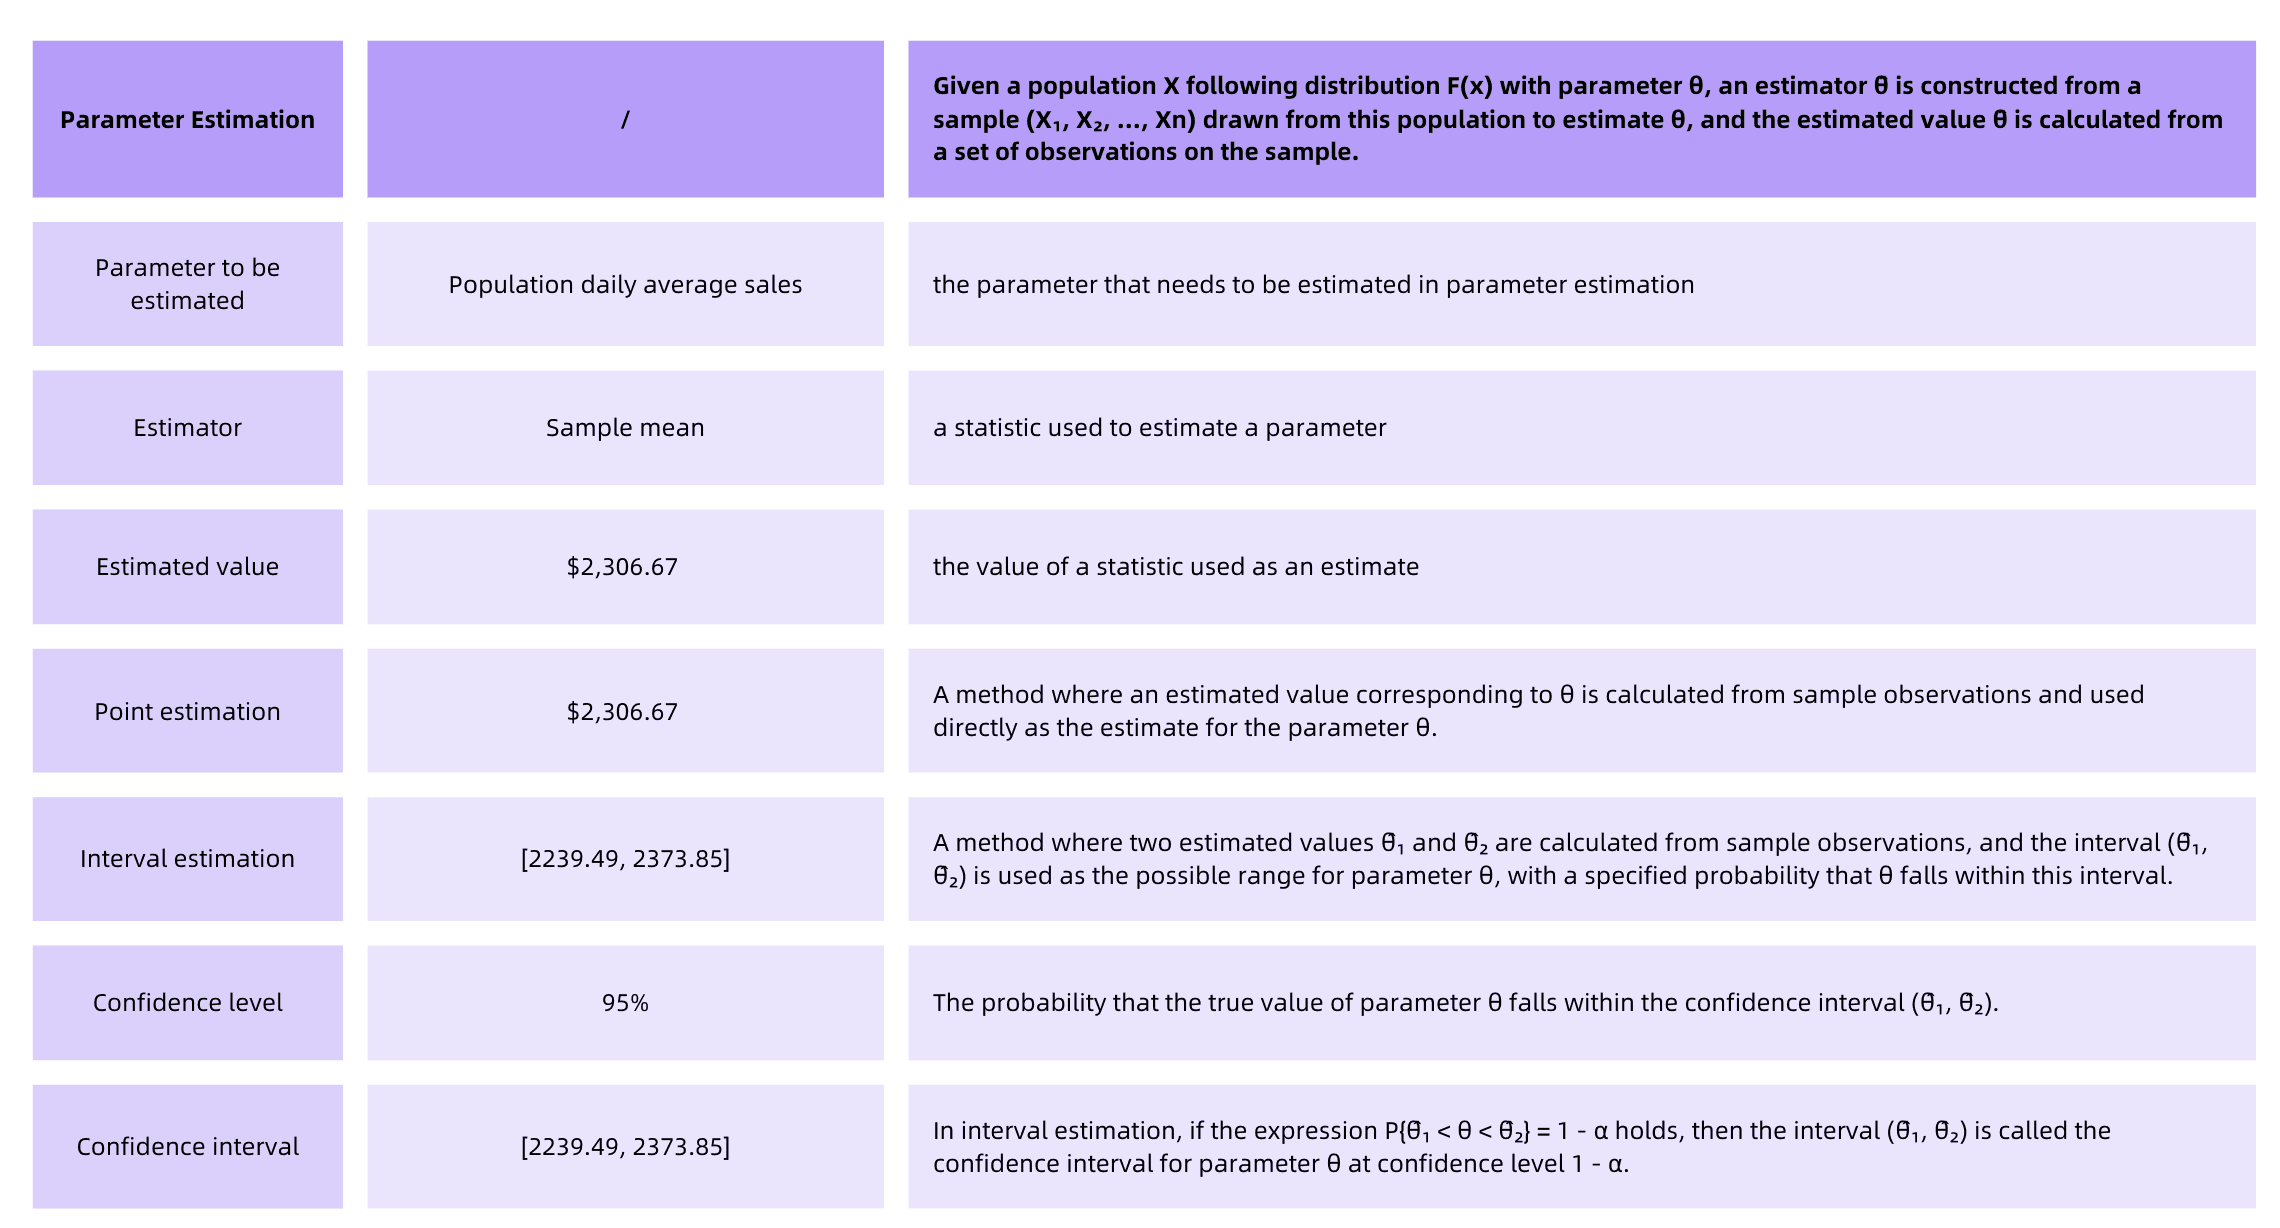
8+4 needed related concepts in Parameter Estimation

1. parameter to be estimated: the parameter that needs to be estimated in parameter estimation
2. estimator: a statistic used to estimate a parameter
3. estimated value: the value of a statistic used as an estimate
4. parameter estimation: Given a population X following distribution F(x) with parameter θ, an estimator θ̂ is constructed from a sample (X₁, X₂, …, Xₙ) drawn from this population to estimate θ, and the estimated value θ̂ is calculated from a set of observations on the sample.
5. point estimation: A method where an estimated value corresponding to θ is calculated from sample observations and used directly as the estimate for the parameter θ.
6. interval estimation: A method where two estimated values θ̂₁ and θ̂₂ are calculated from sample observations, and the interval (θ̂₁, θ̂₂) is used as the possible range for parameter θ, with a specified probability that θ falls within this interval.
7. confidence level: The probability that the true value of parameter θ falls within the confidence interval (θ̂₁, θ̂₂).
8. confidence interval: In interval estimation, if the expression P{θ̂₁ < θ < θ̂₂} = 1 — α holds, then the interval (θ̂₁, θ̂₂) is called the confidence interval for parameter θ at confidence level 1 — α.
— -
The four criteria for Parameter Estimation:
Criteria-1.unbiased estimator:
If θ̂ is an estimator of parameter θ and E(θ̂) = θ, then θ̂ is called an unbiased estimator of θ.
Criteria-2. effective estimator:
If θ̂₁ and θ̂₂ are two unbiased estimators of parameter θ, θ̂₁ is said to be more efficient than θ̂₂ if it has a smaller variance.
Criteria-3. consistent estimator:
An estimator θ̂ is called a consistent estimator of parameter θ if θ̂ converges to θ as the sample size n approaches infinity, i.e., lim θ̂ = θ.
Criteria-4.fully estimator:
An estimator that fully utilizes all the information provided by the sample about the parameter to be estimated.
Here are today’s contents on inferential statistics — parameter estimation. Please follow and subscribe to Bayeslab. Next time, we will specifically introduce the second part of inferential statistics: hypothesis testing.
About Bayeslab
Bayeslab: Website
The AI First Data Workbench
X: @BayeslabAI
Documents: https://bayeslab.gitbook.io/docs
Blogs:https://bayeslab.ai/blog
