Welcome back to the AI Bayeslab Statistics series. I understand that you possess extensive data resources in your position. Utilizing the Bayeslab AI Agent online tool, you will discover that nearly 90% of your data analysis tasks can be handled autonomously, eliminating the need for a dedicated data analyst.
Next, we will delve into the statistical aspect of paired data analysis, following our introduction to its definition, table structure, and characteristics.
This post will begin with an intuitive case study involving a paired t-test AI Agent, facilitated through prompts. We will then examine the underlying formula. To conclude, we will showcase a specialized and advanced chart visualization with a highly desirable estimation plot.
1.Study Case with AI prompts
1.1 Data samples
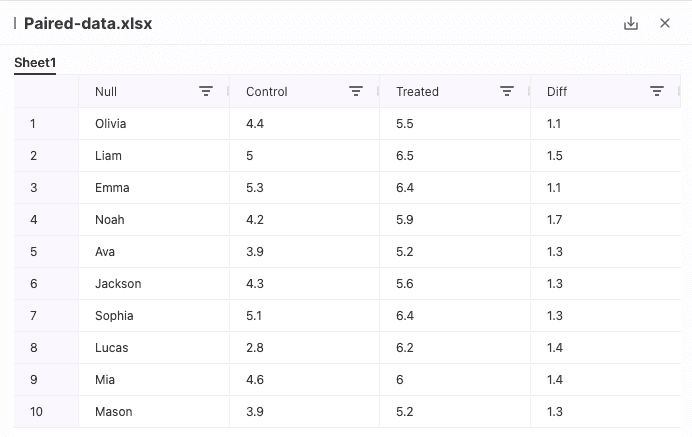
There is a table sheet:
Column 1: Subject name (represents each row's title)
Column 2: Control score (represents the score under the control condition)
Column 3: Treated score (represents the score under the treatment operation)
Column 4: Diff (represents the difference between the control and treated scores)
The field Diff represents the difference between the control and treated scores, calculated as Diff = Treated score - Control score.
1.2 AI Block With Prompts
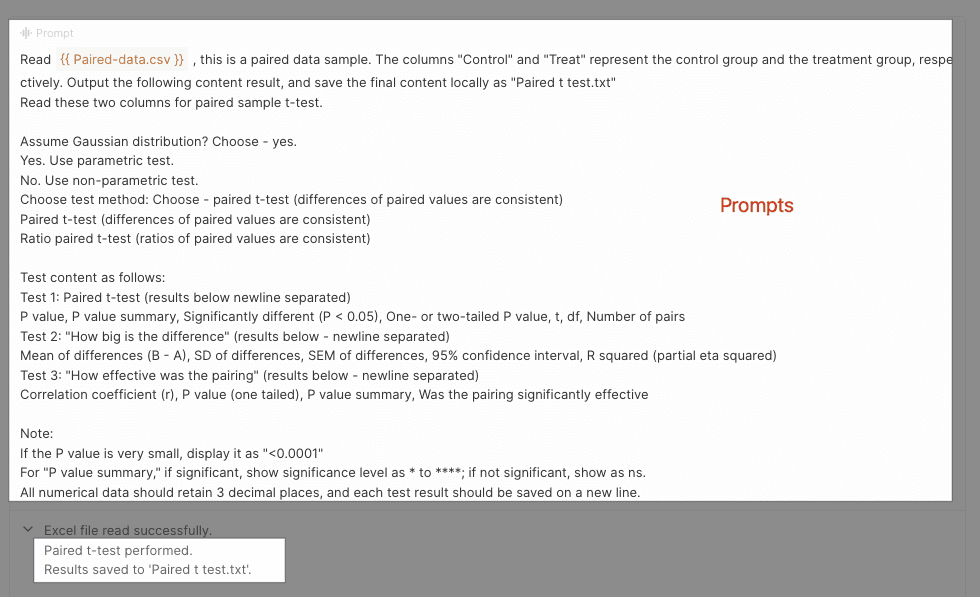
The following example shows that a user can employ natural language with an AI agent or a large language model, which will then translate their prompt requirements into Python code.
1.3 Analysis Result
Following manipulating the AI file, we will create a result using the aforementioned process. After this, we can click to access it and verify the accuracy of the analysis results.

As aforementioned, this is all the content about this case study that we want to show you: a paired data analysis facility with AI.
2.Paired data: formula
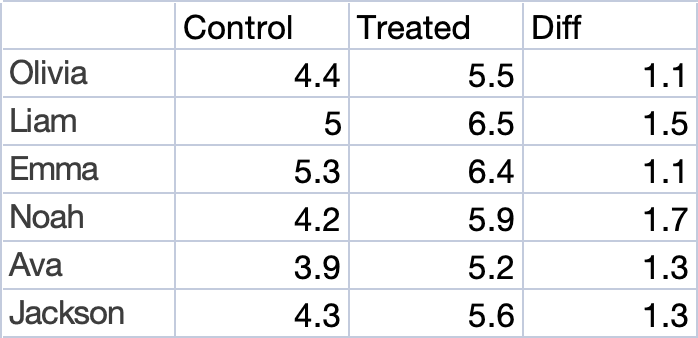
Let’s refer to the sheet data to better understand the formula we will use.
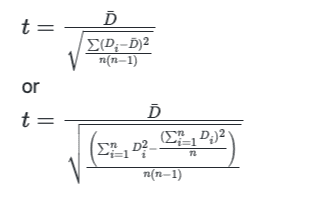
In which:
$$\bar{D}$$ is the mean of the paired differences (sum of the differences divided by the number)
$$_D$$ is the standard deviation of the paired differences
$$$$ is the number of pairs
Or
And as the regular sampling rule, if the number of individuals in each group exceeds 30(n > 30), we can also use Z-distribution.
3.Paired data example
Question: Under the 0.05 significance level, is there significance between the before-and-after treatment?
H₀: μ₁ = μ₂ or μ₁-μ₂= 0
H₁: μ₁ ≠ μ₂ or μ₁-μ₂≠ 0
Revisiting this table data:

As the common steps:
Substitute the ( D ) value into the formula to calculate the ( t ) value.
Decide on the criteria value
Make a decision
3.1 Calculate the ( t ) value with the AI Agent
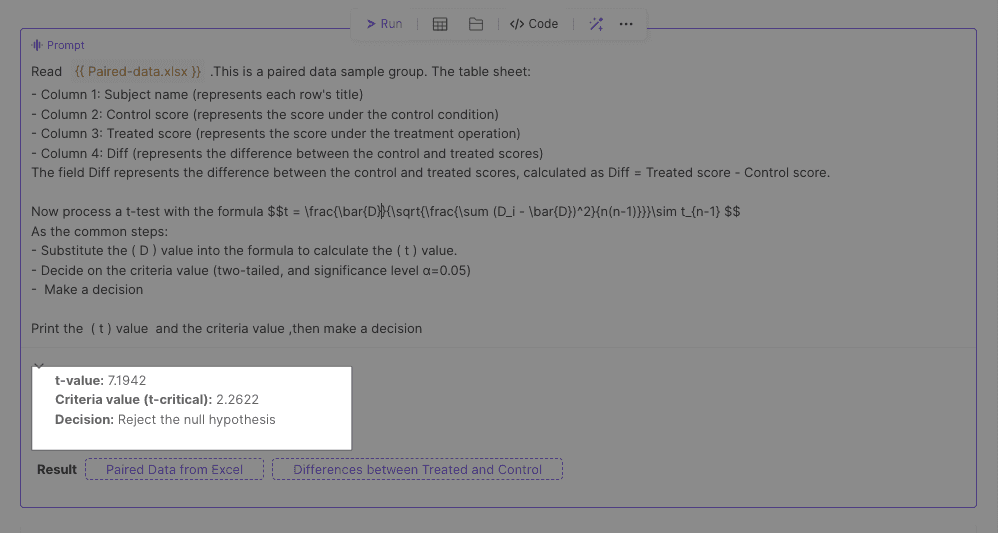
3.2 Plot the t-distribution curve and shade the rejection region.

4.Visualization diff: Paired data vs unpaired data
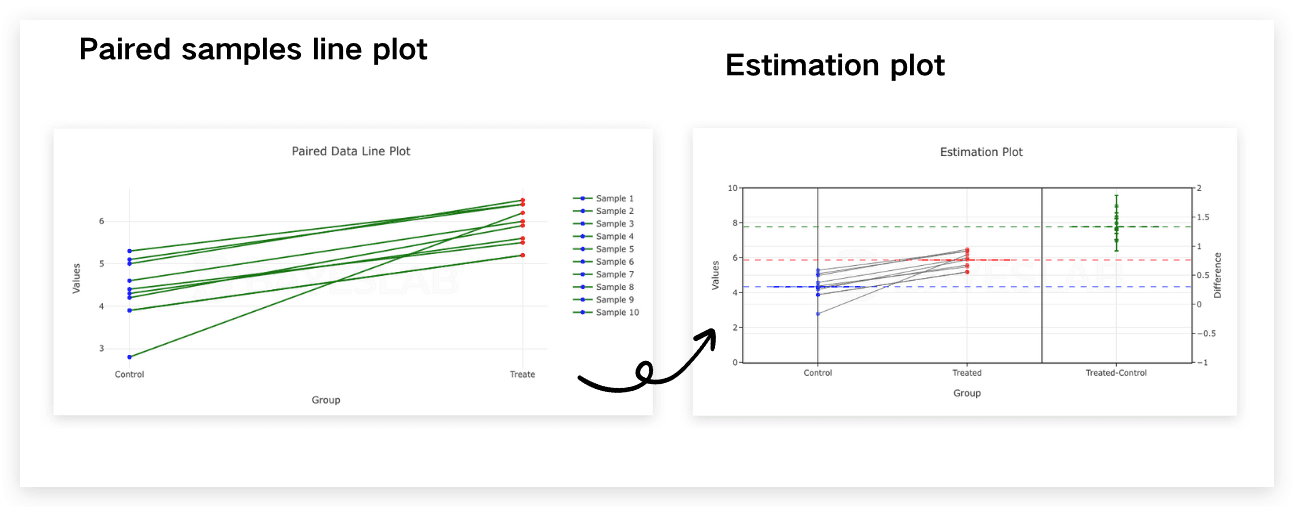
4.1 Estimation Plot: Paired Data VS Unpaired Data
First, let’s examine the difference estimation plot for “Paired Data VS Unpaired Data.” In the same row, you will find a segment that connects the relevant sample data(Scatter Points).

4.2 The advantage we using an estimation plot:
This statistical visualization serves as an essential tool in the analysis of treatment effects, particularly when working with related samples. It has the distinct advantage of providing a clear and comprehensive illustration of the differences observed in treatment effects, emphasizing the significance of before-and-after changes in a given subject.
By effectively highlighting these variations, this type of visualization allows researchers and practitioners alike to grasp complex data more intuitively and make informed decisions based on observed outcomes. In comparison to other visualizations, this method offers a more straightforward and impactful representation, greatly enhancing the understanding of how treatments can influence results over time.
OK, that’s all the content we discussed today.
Stay tuned, subscribe to Bayeslab, and help everyone gain mastery in the wisdom of statistics affordably.
AI prompts are potent tools that help us efficiently complete various tasks and achieve desired outcomes. By utilizing technology in this manner, I believe we have a remarkable opportunity to reintroduce statistics into everyday life, reigniting interest in data and fostering analytical thinking.