Today, let's explore the fascinating combination of AI and statistics through visual examples generated by the AI analysis tool Bayeslab, with a focus on the most common statistical concept: the normal distribution.

1.why normal distribution is important?
The normal distribution was first proposed by A. de Moivre when studying the limit distribution form of the binomial distribution, although it initially received little attention. It was later highlighted in the 19th century by C.F. Gauss and M. de Laplace. The importance of the normal distribution lies in its significant theoretical value and strong practical advantages. Many random phenomena follow or approximate a normal distribution, such as biometric measurements, financial market variables, and noise errors.
The symmetry of this distribution, supported by the Central Limit Theorem, makes large-sample estimation and inference exceptionally simple and effective. Additionally, many statistical tests and inference methods are predicated on the assumption that data follow a normal distribution, further emphasizing its importance.
2.When normal distribution is used?
The normal distribution is used as a fundamental tool in many fields.
For example:
In finance, it is used to model stock returns and assess risk.
In medical research, it analyzes patient physiological indicators.
In manufacturing, it is applied for quality control and improvement analysis.
Interesting everyday examples include:
(1) Height at a gathering:
Imagine a party with many people. Most individuals will have a height around a certain average, while very tall or short people are relatively few. This illustrates a normal distribution of heights, with the highest concentration around the average height and fewer individuals as you move away from it.
Exam scores:
Suppose most students in a class achieve average scores on a math test, with only a few students scoring particularly high or low.
This score distribution typically forms a bell curve, representing the normal distribution where the majority are in the middle and extremes are rare.
Cookie sizes in quality control:
If you run a cookie factory targeting 50 grams per cookie, the actual weights will mostly hover around 50 grams, with slight variations like 49 grams or 51 grams.
This distribution forms a bell curve, indicating that a randomly picked cookie from the production line is very likely to weigh close to 50 grams.
In these applications, the normal distribution provides an ideal mathematical model that helps in more accurate data analysis and prediction.
In summary, the normal distribution reflects the "law of the majority," where most things tend towards the middle, and extremes are rare. As people often say, "moderation is key."
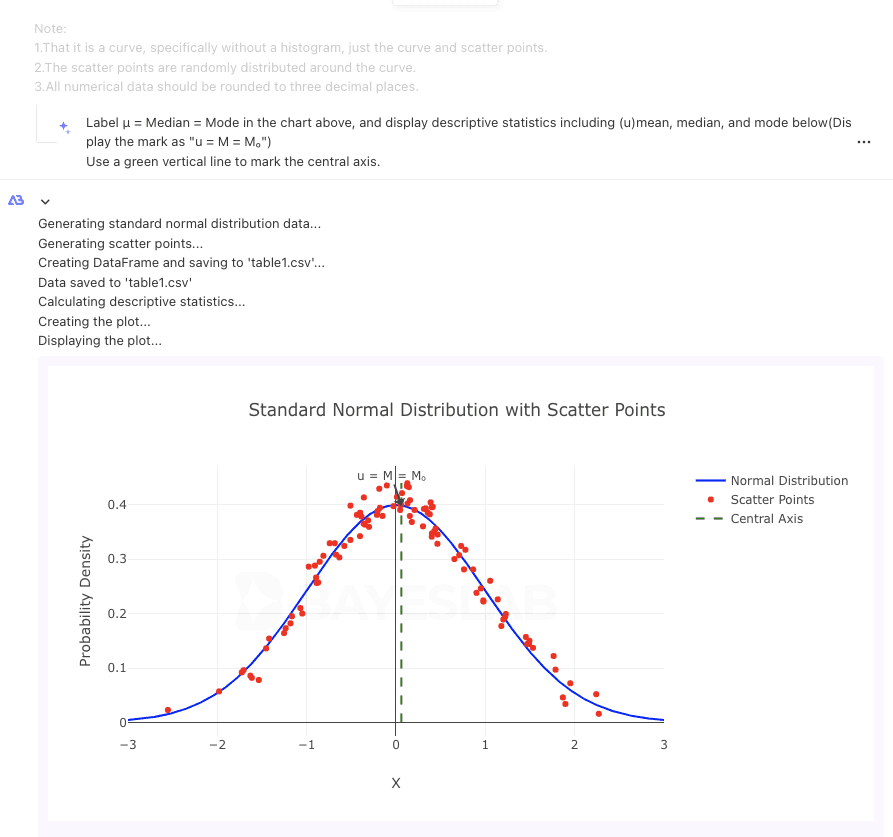
3.Normal distribution looks like

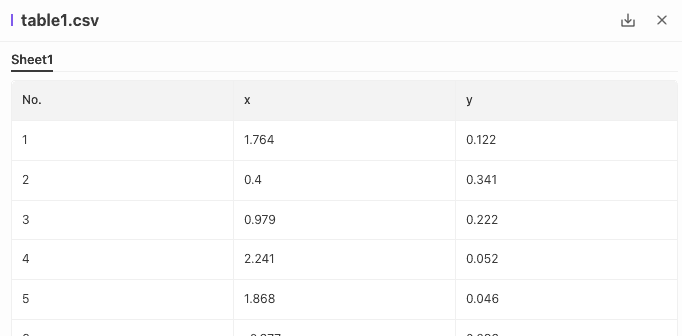
Then we get the result file:

4. Normal distribution where is the mean?
In a normal distribution, the mean is located at the center of the curve and serves as the axis of symmetry, determining the central position of the data.
The mean is a descriptive statistic of the overall data and, in a symmetric normal distribution, is also the median and mode.


5.Normal distribution with standard deviation
Standard deviation is a statistical measure of data dispersion.
In a normal distribution, the standard deviation determines the "width" of the curve.
A larger standard deviation indicates a wider data distribution range, while a smaller standard deviation means the data is more concentrated.
Approximately 68% of the data lies within one standard deviation of the mean, and 95% lies within two standard deviations.
Below you can see three normal distributions:
- The red and blue curves share the same mean (μ) but have different variances (σ²).
- The green and blue curves have different means (μ) but the same variance (σ²).
From the above mean (μ) and standard deviation (σ), we can see that for the shape of a normal distribution curve:
- μ represents the position of its central axis of symmetry.
- σ represents the steepness of the overall curve, indicating the dispersion of sample data points.
The smaller the dispersion (i.e., the smaller the σ), the steeper the normal distribution curve.

Summary: Based on the examples above, we can summarize the concept of the normal distribution curve and its relationship between shape, mean, and variance.
Concept Explanation:
Distribution 1: Normal distribution curve X~N(μ,σ²)
- a continuous probability distribution that forms a symmetrical bell-shaped curve, where μ is the mean and σ² is the variance.
- Curve Shape in relation to mean μ and variance σ²:
When the mean μ is the same:
Larger variance σ² results in a flatter normal distribution curve.
Smaller variance σ² results in a steeper normal distribution curve.
When the variance σ² is the same:
- A larger mean μ shifts the entire normal distribution curve to the right.
- A smaller mean μ shifts the entire normal distribution curve to the left.
In the next template, we will specifically introduce other related issues about the normal distribution:
6. What is density function?
7. Normal distribution with percentages
8. what is the 68 95 99.7 rule?
9. Normal distribution to standard normal distribution
10.Normal distribution with z scores
About Bayeslab :
Bayeslab: Website
The AI First Data Workbench
X: @BayeslabAI
Documents: https://bayeslab.gitbook.io/docs
Blogs:https://bayeslab.ai/blog

Bayeslab is a powerful web-based AI code editor and data analysis assistant designed to cater to a diverse group of users, including :
👥 data analysts ,🧑🏼🔬experimental scientists, 📊statisticians, 👨🏿💻 business analysts, 👩🎓university students, 🖍️academic writers, 👩🏽🏫scholars, and ⌨️ Python learners.