
We often approach "data analysis" with high hopes—expecting it to quickly reveal trends, validate hypotheses, and drive decisions. Yet reality is frustrating: before the real analysis even begins, we’re already exhausted by dirty data, Excel wrangling, field cleaning, and dimension alignment.
You might relate to this:
70% of "data analysis" time is consumed by data cleaning and preparation.
This isn’t just a technical hurdle—it’s repetitive, tedious, and a tangible drag on business momentum.
As an AI agent, Bayeslab helps you with data cleaning, visualization, model analysis, and other data processing tasks.
1. Making Dirty Data "Clean" Instantly
Bayeslab isn’t just a question-answering bot. Before analysis begins, it handles the heavy lifting:
✅ Auto-Detection of Dirty DataIdentifies missing values, duplicates, or malformed fields (e.g., phone numbers, timestamps, empty entries) and flags them for action.
✅ Smart Cleaning Suggestions
For example:
Mixed date formats like "2025/06/01" and "06-01-2025" in a "signup_time" column
Bayeslab suggests standardization.
20% empty values in a column? It evaluates whether to impute, drop, or retain them—with reasoning.
✅ Business-Field Recognition
Automatically detects common fields (e.g., user_id, signup_date, channel), eliminating manual labeling and setup.
All you do: Upload your file or tell the Agent which database table to analyze.
2. One-Click Visual Reports, Multi-Dimensional Insights
Post-cleaning, Bayeslab generates structured reports with charts, insights, and actionable suggestions.
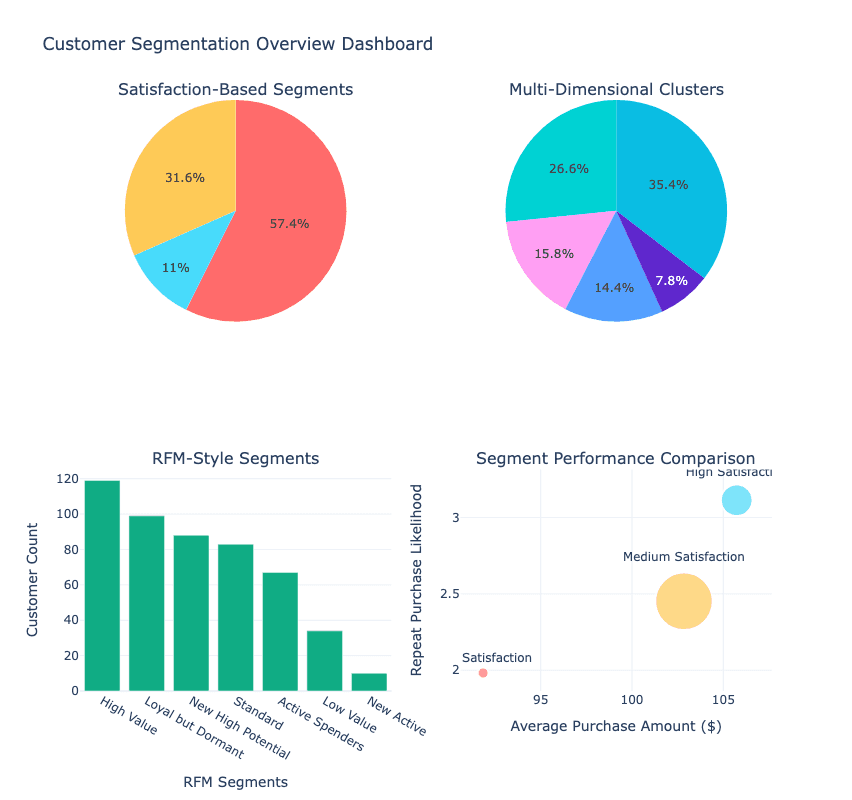
(Image automatically generated by Bayeslab based on data)
Supported Visualizations:
Line charts (trends)
Pie/bar charts (composition)
Funnel charts (conversion paths)
Heatmaps (spatial/temporal patterns)
Custom comparisons (e.g., channel vs. retention)
……
Every chart comes with explanations:
"New user growth spiked in Week 2 of June—likely tied to the campaign launch."
"XX-registered users show the highest retention (34.8%) among all channels."
No more manual PPT stitching. Bayeslab exports ready-to-share reports (charts + narratives) for meetings, cross-team collaboration, or executive decisions.
3. Free Your Time for Real Thinking
Hours wasted on data cleaning and chart-making should be automated. With Bayeslab, they finally are.
It doesn’t just save time—it refocuses your energy on what matters:
Why does this user cohort retain better?
Which marketing channel delivers the highest ROI?
What micro-optimizations could boost conversion?
You focus on decisions. Bayeslab handles the data—cleaned, explained, and visualized.
Bayeslab: Reinventing Data Analysis
Bayeslab is your ally—simplifying complexity, handling details, and illuminating the path forward.
Whether you’re a solo founder or a corporate analyst, Bayeslab ensures:
No expertise needed. Just expert-level insights and storytelling.
Bayeslab · Empowering Every Data Explorer.