Today, let’s explore the fascinating combination of AI and statistics through visual examples generated by the AI analysis tool Bayeslab.
In this guide, we delve into the descriptive statistics, providing a foundational understanding before moving into inferential statistics. Detailed explanations and implementation steps for inferential statistics will be covered in subsequent materials.
Statistics is divided into descriptive statistics and inferential statistics:
● Descriptive Statistics: Studies various metrics and probability distributions
● Inferential Statistics: Studies how to infer the whole population based on sample information

Table of Contents
1. Descriptive statistics definition
1.1 what are statistical measures?
1.2 What are the 5 basic concepts of statistics?
1.3 Probability distribution for random variable
1.4 AI illustration — Data Visualization(1)
2. Inferential of statistics definition
2.1 Parameter estimation
2.2 Hypothesis testing
2.3 What is effect size?
3. What is the difference between inferential and descriptive statistics?
4. What is an example of descriptive statistics?
4.1 Descriptive statistics sample
5. What is an example of an inferential statistic?
5.1 Inferential statistics sample
1. Descriptive statistics definition
Descriptive statistics involve methods for collecting, summarizing, and describing data, focusing on the characteristics and probability distributions of the processed data.
1.1 what are statistical measures?
Common statistical measures in descriptive statistics:
1. Central Tendency: Measures typical levels or central trends in data, including arithmetic mean, weighted mean, geometric mean, median, and mode. These help us understand the central tendency of the data.
2. Dispersion: Reflects the spread or variability in data, such as range, mean deviation, variance, standard deviation, and coefficient of variation. These metrics provide detailed information about data distribution.
3. Positional Measures: Describe the position of data within the dataset, including percentiles, percentile ranks, quartiles, and quantiles. These help determine the data’s position within the dataset.
4. Correlation: Describes relationships between two or more variables, including covariance and correlation coefficients like Pearson’s and Spearman’s rank correlation coefficients. These measures help understand the strength and direction of relationships between data.
5. Skewness and Kurtosis: Describe the shape of data distribution. Skewness reflects the symmetry of the distribution, while kurtosis indicates the pawedness. They reflect how data deviates from a normal distribution in terms of skew and spread.
1.2 What are the 5 basic concepts of statistics?
In statistical research, several core concepts are fundamental for understanding and applying statistical methods:
● Random Variable: A variable whose values are determined by random phenomena. In statistics, random variables are typically used to describe potential outcomes in experiments or observations.
● Individual: A member of the population, usually the subject of the study. For instance, in a survey, an individual could be a person, an animal, or an item.
● Population: The entire set of individuals of interest in a study. For example, all residents of a city make up the population of that city’s residents.
● Sample: A subset of individuals taken from the population, used to represent the population for study purposes. Samples are used to infer characteristics of the population.
● Statistic: A descriptive measure calculated from sample data, used to estimate population parameters. Examples include the sample mean and sample variance.
● Parameter: A numerical value that describes a characteristic of the population. Examples include the population mean and population variance.
These concepts form the basic framework of statistics, helping researchers organize and understand data for effective analysis and inference.
1.3 Probability distribution for random variable
A probability distribution is a function that describes all possible outcomes of a random variable and their corresponding probabilities.
Based on the type, probability distributions can be categorized into:
▶︎ Discrete Random Variables: Variables that can take a finite or countably infinite number of specific values. A common example is the binomial distribution.
▶︎ Continuous Random Variables: Variables that can take an infinite number of values, typically over a real number range. The most common example is the normal distribution.
Other common probability distributions include: Poisson distribution, exponential distribution, chi-squared distribution, t-distribution, and F-distribution.
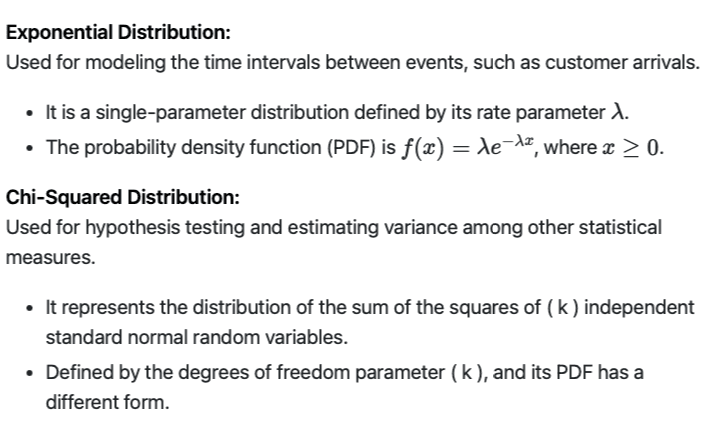
Although the exponential distribution and chi-squared distribution might appear similar in shape, they have different definitions and applications:

Though they may look similar in certain cases, their applications and mathematical properties are quite distinct.
1.4 AI illustration — Data Visualization(1)

2. Inferential of statistics definition
All the statistical measures mentioned in the previous description of descriptive statistics can be divided into those of “samples” and “populations.”
What is parameter estimation?
Parameter estimation: Estimating population characteristics (parameters) based on sample characteristics (statistics).
Business Case: Suppose you are a data analyst at a retail company and need to analyze this year’s sales data to predict next year’s sales trends.
▶︎ Sample Statistics: For example, using the sales data from the first six months of this year (sample) to calculate average sales (arithmetic mean), the range of sales (range), and the degree of fluctuation (standard deviation).
▶︎ Population Statistics: The entire year’s sales data as the population. When real-time analysis of the whole year’s data is not feasible, sample statistics can represent the characteristics of the entire sales year.
By using the sample data from the first six months (e.g., mean, variance) to the sales trends for the entire year (population parameters), you can predict the average annual sales through the sample mean and estimate the annual fluctuation in sales (using the sample standard deviation to estimate the population standard deviation).
Similar template data analysis cases can be referred to: https://editor.bayeslab.ai/libraryDetail?tid=dd679c73-ac3d-4a1d-8522-a7fab5244963

2.2 Hypothesis testing
Hypothesis testing involves making a decision to retain or reject a hypothesis about a population parameter or distribution shape.
Here, let’s illustrate with an example:
A company wants to know whether a promotional campaign effectively increased sales and wishes to decide whether to continue using this strategy in future promotions.
Step 1: Compute Statistics
First, collect two sets of data: sales data for the six months before the promotion (Sample 1) versus sales data for the six months after the promotion (Sample 2).
Then, perform the following statistics on these data sets:
▶︎ Mean: Calculate the average monthly sales before and after the promotion.
▶︎ Standard Deviation: Calculate the monthly sales fluctuation for these two periods.
Step 2: Parameter Estimation
Use the sample mean and standard deviation from the six months after the promotion to estimate the overall sales level and fluctuations post-promotion:
▶︎ Estimate Population Mean: Assume that the mean of the six months post-promotion represents the average sales level for the entire post-promotion year.
▶︎ Estimate Population Standard Deviation: Similarly, use the sample standard deviation to estimate the annual sales fluctuation after the promotion.
Step 3: Hypothesis Testing
To determine whether the promotional campaign significantly increased sales, conduct a hypothesis test:
▶︎ Null Hypothesis (H0): There is no significant difference in sales means before and after the promotion (i.e., the promotion is ineffective).
▶︎ Alternative Hypothesis (H1): The mean sales after the promotion are significantly higher than before (i.e., the promotion is effective).
Perform a t-test (or other appropriate hypothesis testing methods) and obtain the p-value:
▶︎ If the p-value is less than the significance level (e.g., 0.05), reject the null hypothesis, indicating that the promotion significantly increased sales, and consider continuing with this promotional strategy.
▶︎ If the p-value is greater than the significance level, do not reject the null hypothesis, indicating that the promotion did not have a significant impact on sales, and reconsider or optimize the promotional strategy.
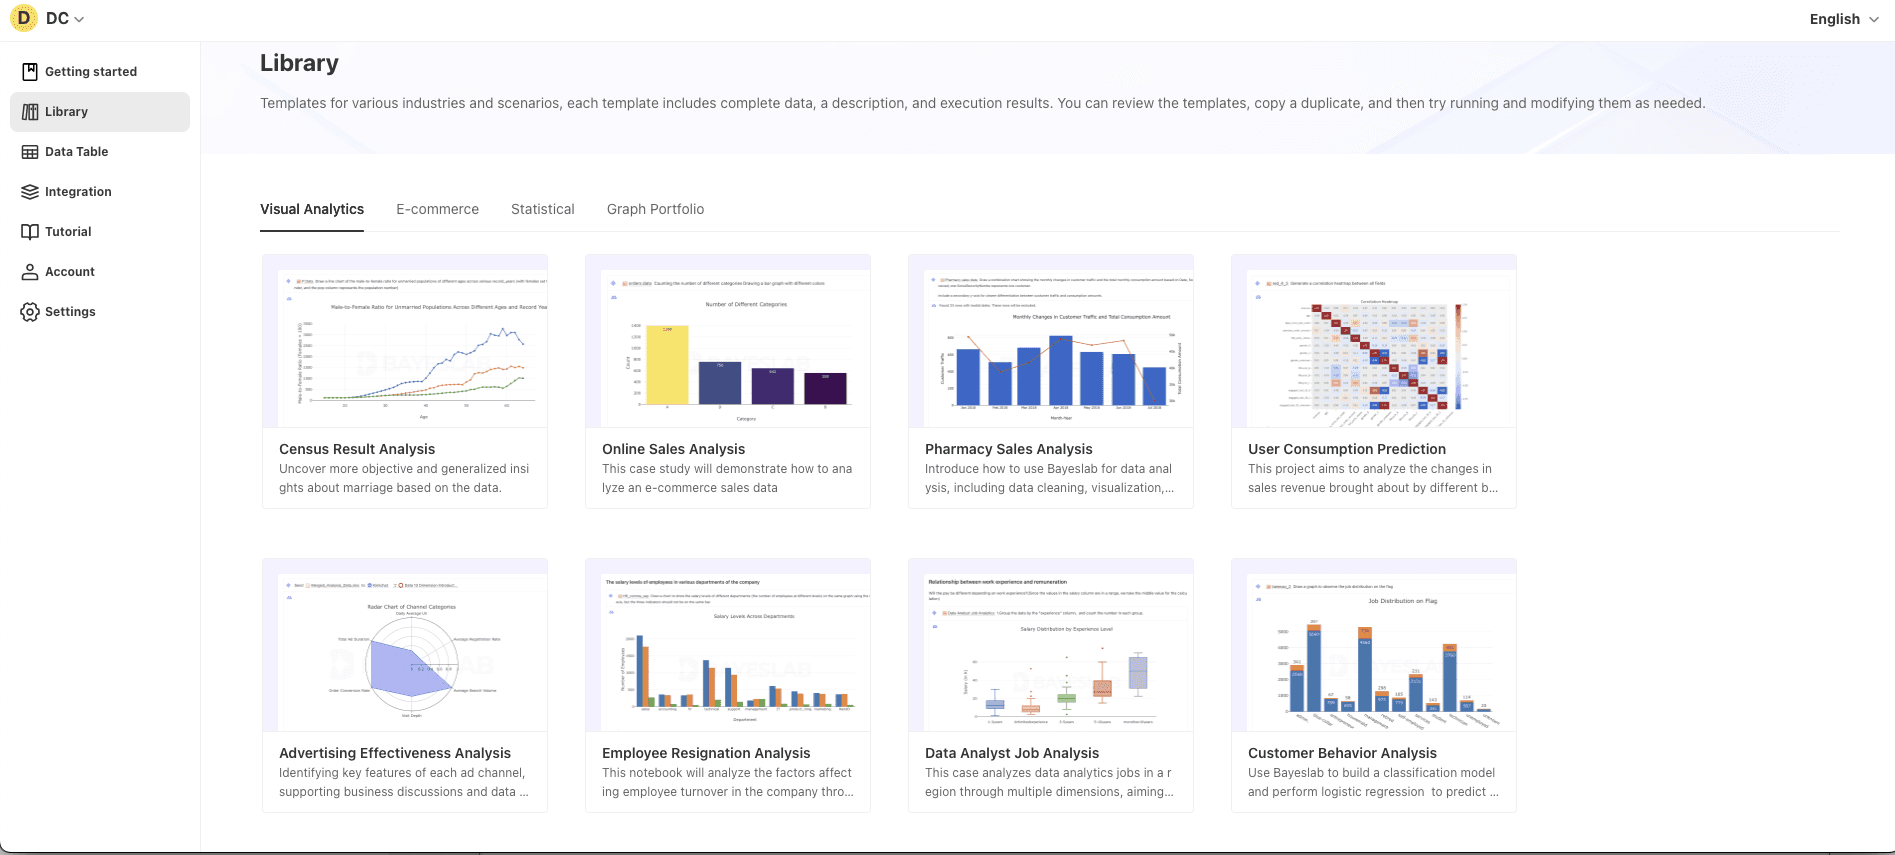
For various data source table structures, the Bayeslab library contains visualization and statistical analysis methods that can be used.: https://editor.bayeslab.ai/library

2.3 What is effect size?
Effect size relates to several fundamental statistical concepts mentioned in the descriptive statistics definition above. It is important for statistical inference, but we first introduce it here to enhance our understanding of the previously discussed concepts in data analysis.
Relation of Effect Size with Statistical Concepts:
● Effect Size:
○ An important statistical concept used to quantify the magnitude of a treatment effect or the difference between two populations.
○ t indicates not only whether a difference exists but also measures the size of the difference.
● Treatment Effect:
○ Refers to outcome changes caused by specific treatment, intervention, or operation in an experiment or study.
○ It measures the difference in response variables between the treatment group and the control group, reflecting the actual impact of the specific operation.
○ In business contexts, treatment effect can evaluate the impact of new measures.
For example, an online retailer implements a new promotional strategy, such as personalized discount codes, aiming to increase customer purchases.
To assess this strategy’s effect, the retailer may randomly divide users into two groups:
● One group receives the personalized discount codes (treatment group).
● The other group does not (control group).
By comparing the average purchase difference during the promotion between the treatment group and the control group, the retailer can quantify the treatment effect of the promotional strategy. This way, it can determine whether the strategy effectively increased customer purchases and the size of its impact.
In statistics, effect size is a vital tool for understanding the practical significance of data results. Common effect sizes include Cohen’s d, correlation coefficient r, and odds ratios, among others (detailed in the next section on statistical inference).
Effect size is closely related to the aforementioned statistical concepts:
● Random Variable:
○ Effect size is often computed from random variables observed in the study.
○ Random variables represent characteristics or outcomes of interest for evaluation through effect size.
● Individual and Population:
○ Effect size describes the impact of treatment at the individual level on population characteristics.
○ It helps researchers understand the strength of certain features or treatment effects within a population.
● Sample:
○ Effect size is generally calculated from sample data and used to estimate and infer the population effect size.
● Statistic:
○ Effect size is a form of statistic as it extracts information from sample data to estimate the strength or difference of population characteristics.
● Parameter:
○ Effect size can be seen as an estimate of population parameters (e.g., mean differences or association strengths), providing information about their magnitude or importance.
○ Effect size serves as a tool to connect these statistical concepts, offering a quantitative assessment of population characteristics or experimental effects, thereby allowing researchers to better understand and interpret data.
Understanding these basic concepts and their interrelationships enables a deeper study of statistics and the application of this knowledge to real-world data interpretation.
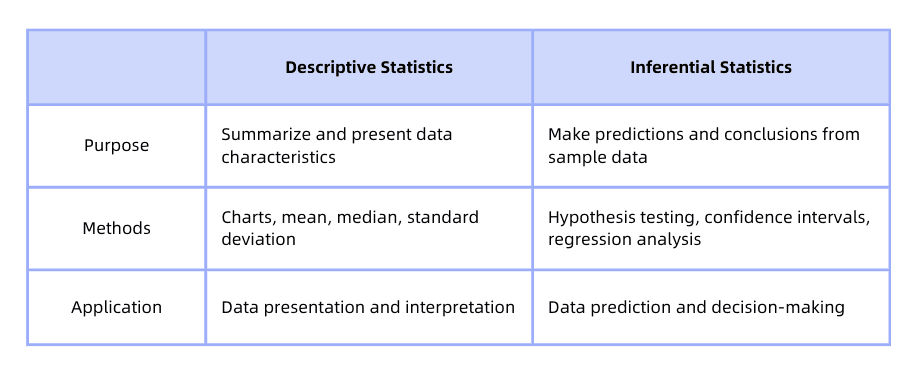
3. What is the difference between inferential and descriptive statistics?

Connections:
▶︎ Foundation: Descriptive statistics provide a basic overview of the data, serving as the starting point for inferential analysis.
▶︎ Process: Typically, analysis begins with descriptive statistics before moving to inferential statistics.
▶︎ Interdependence: Together, they offer a complete understanding of the data, from simple descriptions to complex inferences.
4. What is an example of descriptive statistics?
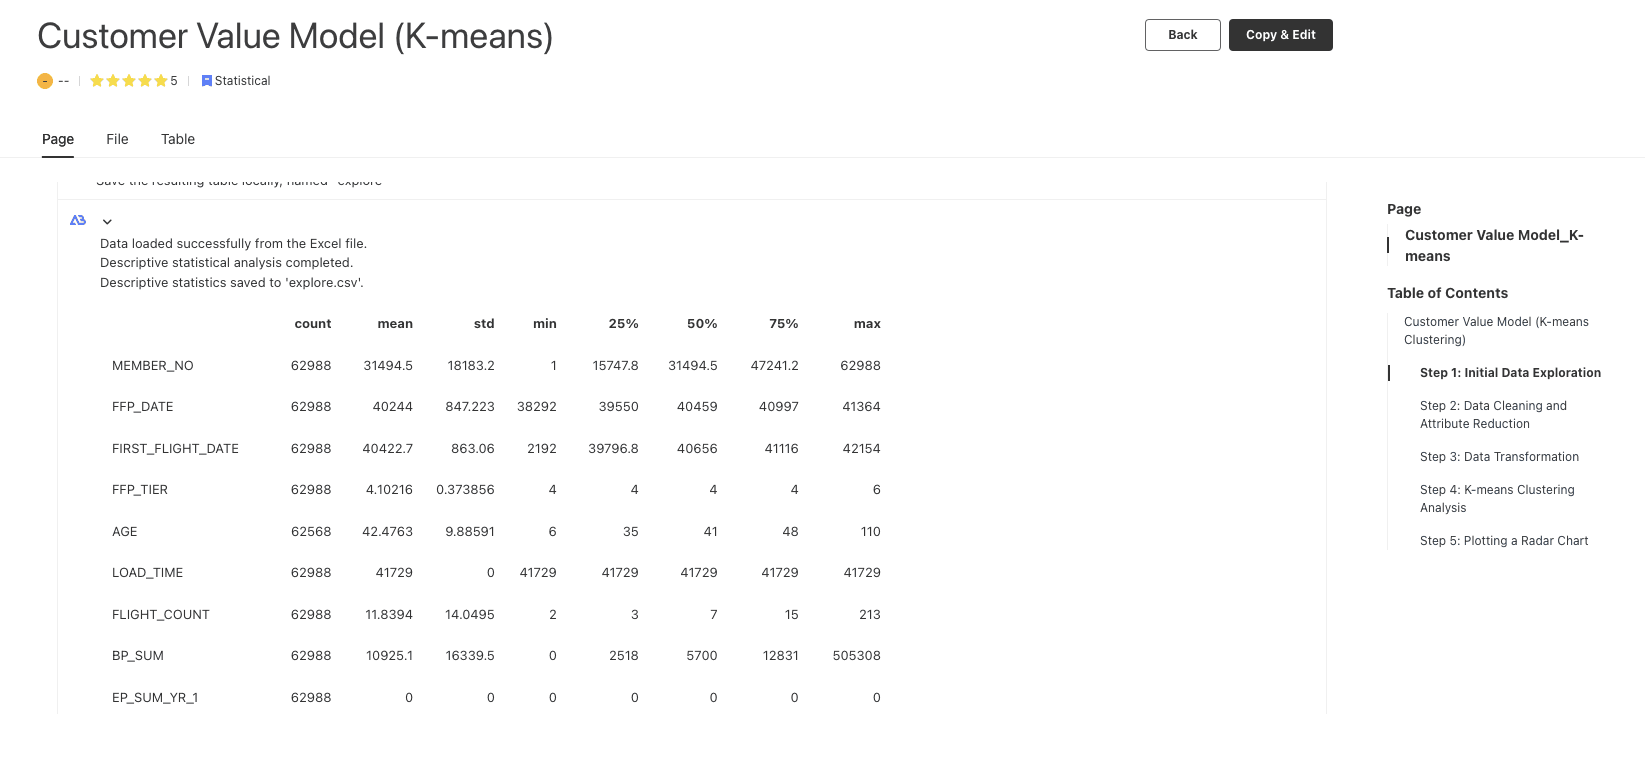
4.1 Descriptive statistics sample
An example of statistical description can be seen in the data exploration steps within this template: https://editor.bayeslab.ai/libraryDetail?tid=28fec9ca-a40f-44c0-be1c-e2be23c07114

5. What is an example of an inferential statistic?
5.1 Inferential statistics sample
Finally, let’s illustrate the relationship between descriptive statistics and inferential statistics in business analysis with a concrete example.
Suppose a newly opened chain coffee shop wants to understand its customers’ consumption habits to optimize its pricing strategy.
1. First, the coffee shop can use descriptive statistics to analyze sales transaction data over a month.
This includes calculating the average transaction amount, the frequency of customer purchases, and the most commonly bought product combinations.
Charts of this data can show the basic patterns of customer purchasing behavior, helping management understand the current situation.
2. Next, the coffee shop can use inferential statistics to predict factors affecting future sales and develop strategies.
Suppose the coffee shop wants to test a new pricing strategy by increasing the price of a popular product to boost profits.
They can randomly select a group of customers to apply the price adjustment (treatment group) while maintaining the original price for another group (control group).
Then, using inferential statistics, they can analyze the data from these sample groups, such as the differences in sales revenue for these products, to infer the potential impact of the price adjustment on overall sales.
In this process, descriptive statistics provide the foundation for understanding and summarizing the current situation, while inferential statistics help management make decisions for the entire customer base based on sample data.
Additionally, effect size measures such as Cohen’s d can quantify the specific impact of the price adjustment on sales revenue, offering detailed and meaningful business insights.
This combination enables the coffee shop to develop and validate business strategies driven by data.
For similar complete business data analysis cases, you can refer to BYESLAB LIBRARY :
● Pharmacy Sales Analysis: https://editor.bayeslab.ai/libraryDetail?tid=23a73cce-a9a7-4f21-8ceb-81aa9113b7c1
● Advertising Effectiveness Analysis: https://editor.bayeslab.ai/libraryDetail?tid=791e9fc9-59b2-4948-8833-50ccd4d36ea4
● Customer Behavior Analysis: https://editor.bayeslab.ai/libraryDetail?tid=942eb55b-c254-4715-a02d-4fe2c626a9d0

About Bayeslab :
Bayeslab: Website
The AI First Data Workbench
X: @BayeslabAI
Documents: https://bayeslab.gitbook.io/docs
Blogs:https://bayeslab.ai/blog

Bayeslab is a powerful web-based AI code editor and data analysis assistant designed to cater to a diverse group of users, including :
👥 data analysts ,🧑🏼🔬experimental scientists, 📊statisticians, 👨🏿💻 business analysts, 👩🎓university students, 🖍️academic writers, 👩🏽🏫scholars, and ⌨️ Python learners.