Welcome to the AI and Statistics series!
Let's dive into how AI can transform tabular data into various types of charts.
Today, we will be using a two-dimensional data table to generate a Waterfall Chart.
Don't worry about using the AI Agent-driven Bayeslab, all you need is natural language to get the data analysis result.
All content will be explained in the most comprehensible natural language descriptions to help you get started with data analysis from scratch.
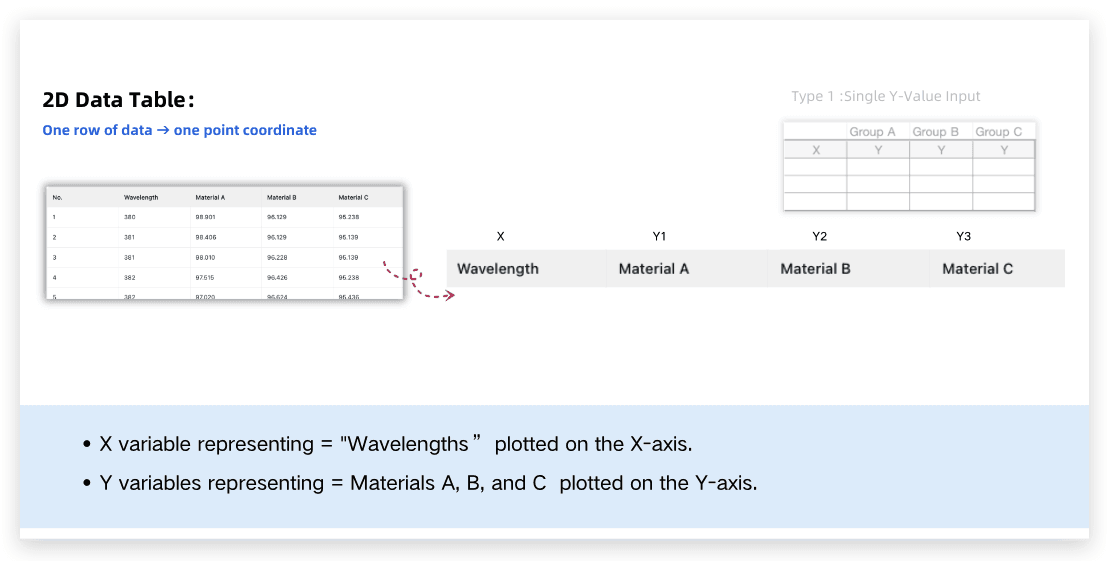
We’ll start with a data table featuring:
Dimension 1 corresponds to the X variable, which we use to plot the X-axis representing Wavelengths.
Dimension 2 is the Y variable, indicating the refractive indices for Materials A, B, and C.

The Simple 2D Table-Waterfall Chart is used to display the cumulative effect of variables, showing step-by-step how positive or negative values impact the initial value, to help understand the process of change in the cumulative result.

We’ll delve into how these prompts influence the final charts and uncover techniques for effective data visualization.
In just 2 minutes, you'll learn to create an effective Waterfall Chart to visualize complex data relations easily. Let's start it right now.
Using different prompt inputs, we'll demonstrate how AI generates three distinct waterfall chart results, including:
Step 1 - Error Demonstration ❌
Step 2 - Beginner Level - Waterfall Chart
Step 3 - Advanced Level - Waterfall Chart
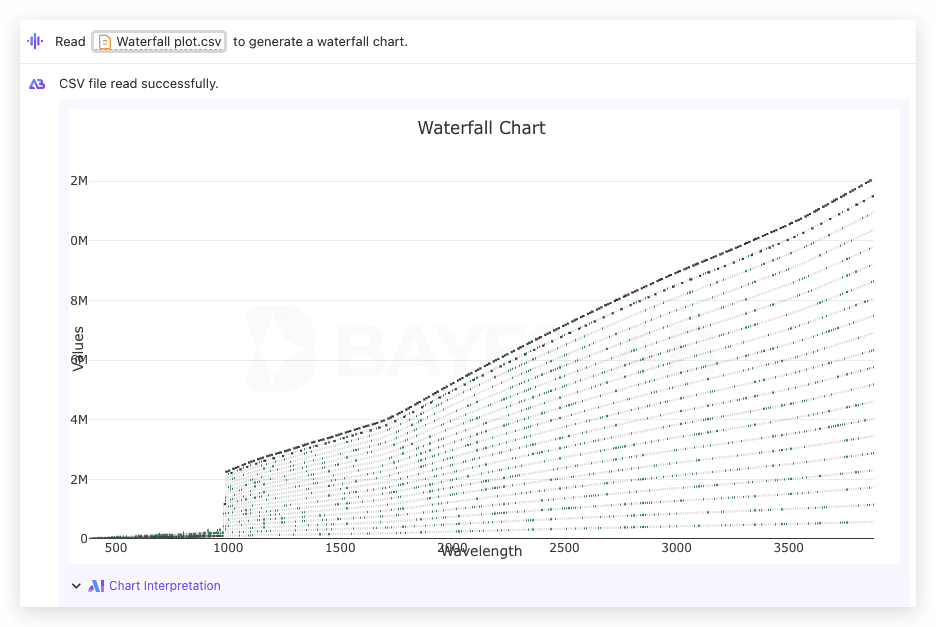
Step 1 - Error Demonstration ❌
In this step, we read the data and generate a simple waterfall chart to identify potential errors.
The Prompt is:
Read Waterfall plot.csv to generate a waterfall chart.
Once the above prompt is written, click 'Run' to see an initial chart with errors in the data setup.

Step 2 - Beginner Level - Waterfall Chart
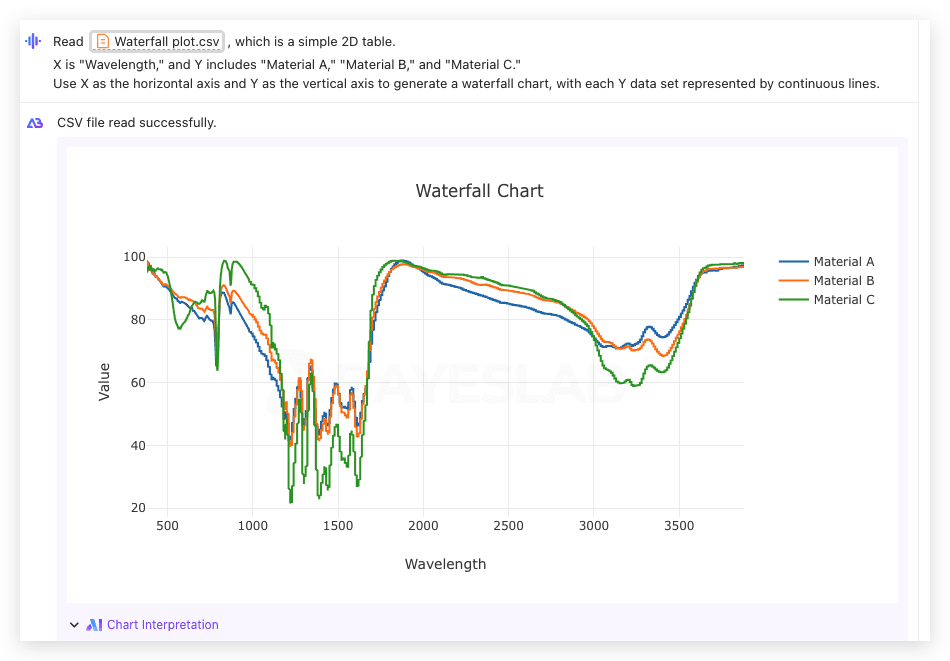
Here, we use a simple 2D table. X is "Wavelength," and Y includes "Material A," "Material B," and "Material C" to generate a waterfall chart with each data set represented by continuous lines.
The Prompt is:
Read Waterfall plot.csv , which is a simple 2D table. X is "Wavelength," and Y includes "Material A," "Material B," and "Material C." Use X as the horizontal axis and Y as the vertical axis to generate a waterfall chart, with each Y data set represented by continuous lines.
Once the above prompt is written, click 'Run' to obtain a basic and correct waterfall chart showing the cumulative effects accurately.

Step 3 - Advanced Level - Waterfall Chart
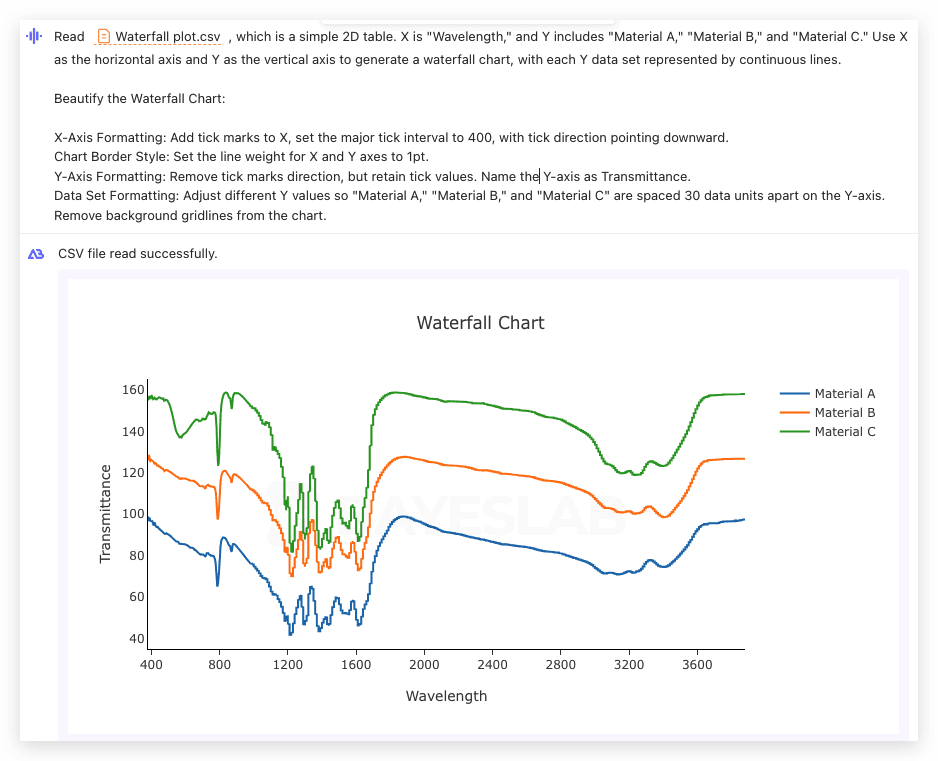
This step involves enhancing the chart by formatting axes and datasets. Differences in prompts include adding tick marks, setting line weights, and spacing Y values apart for improved visualization.
The Prompt is:
Read Waterfall plot.csv , which is a simple 2D table. X is "Wavelength," and Y includes "Material A," "Material B," and "Material C." Use X as the horizontal axis and Y as the vertical axis to generate a waterfall chart, with each Y data set represented by continuous lines.
Beautify the Waterfall Chart:
X-Axis Formatting: Add tick marks to X, set the major tick interval to 400, with tick direction pointing downward.
Chart Border Style: Set the line weight for X and Y axes to 1pt.Y-Axis Formatting: Remove tick marks direction, but retain tick values. Name the Y-axis as Transmittance.Data Set Formatting: Adjust different Y values so "Material A," "Material B," and "Material C" are spaced 30 data units apart on the Y-axis.Remove background gridlines from the chart.
Once the above prompt is written, click 'Run' to view a professionally styled, easy-to-interpret waterfall chart.

Thank you for reading this installment of the AI and Statistics series!
We showed how to create and refine waterfall charts to effectively communicate data insights.
Stay tuned for our upcoming demonstrations to explore more fascinating data visualization.
Using AI Agent and Bayeslab, anyone can organize, analyze, plot data charts, and make business data predictions like a professional data analyst based on previous data.