
Click the link to use the template.
Project Background
Background
As the daily business operations of enterprises proceed, various types of data are inevitably generated within the enterprises. How to utilize these data to draw beneficial insights and support the next product iteration and leadership decisions becomes particularly important. AB testing is a commonly used data-based product iteration method in Internet enterprises. Its main idea is to design different experimental levels (schemes) for different (or the same, homogeneous) samples under the premise of keeping other conditions unchanged, and to judge the influence of independent variables on dependent variables based on the final data performance. The theoretical basis of AB testing mainly comes from the hypothesis testing part of mathematical statistics. Readers can explore this part of statistical knowledge on their own.
Data Description
Among them, test.xlsx is the result data of a certain A/B test on a certain travel platform. The explanations of each field are as follows:
date: Date
group: Group (Control Group / Experimental Group)
requests: Number of Order Requests
GMV: Gross Merchandise Volume
coupon per trip: Coupon Amount per Order
trips: Number of Orders
canceled requests: Number of Canceled Requests
Analysis of AB test effect
Calculating ROI
ROI (Return on Investment) is a financial measure of how profitable an investment is. It is used to evaluate the ratio between the benefits brought by the investment and the investment costs, to help investors and business decision makers understand the effect of their investment, and to compare the profit potential of different investment opportunities.
prompt:
// XXX table caculate ROI(gmv/(coupon per trip*trips)), save it in XXX table.

prompt:
Merge the data from table test and the table ABtest_1 into ABtest_2
Requests Test
There were 58 data, 29 in the control group and 29 in the experimental group, and the sample size was less than 30.
requests variance test
Levene's test was chosen because the two sets of data were small (they did not follow a normal distribution) and there were only two sets of data.
prompt:
Levene's test was used to test whether the variance of requests for the two groups of 'group' was homogeneous.

Looking at the output, we can see that the p-value is much greater than 0.05, which clearly does not reject the null hypothesis. That is, there is no difference between the two sets of variances, homogeneous.
requests mean test
1. The data are the different levels of the same sample before and after the experiment, so the paired sample t-test is used.
Write two sets of requests: mean u1,u2
3. Null hypothesis H0:u1=u2; Alternative hypothesis H1:u1u2
The significance level is 0.05
prompt:
Convert requests to the correct numeric type, using a t-test for paired samples to test the mean of 'requests' for the two groups of 'group'
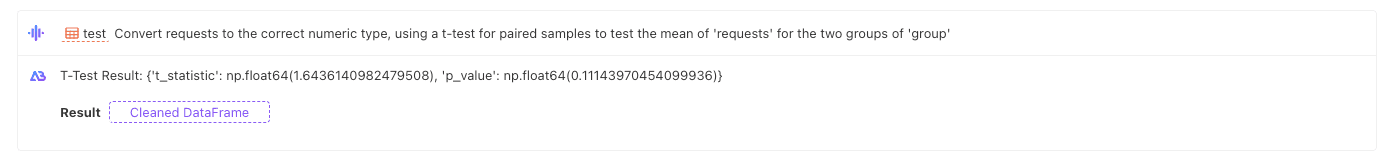
In the same way as above, it can be considered that the effect of experimental conditions on request is not significant.
GMV test
GMV variance test
Same as above
prompt:
Levene's test was used to test whether the variance of the gmv of the two groups was homogeneous.
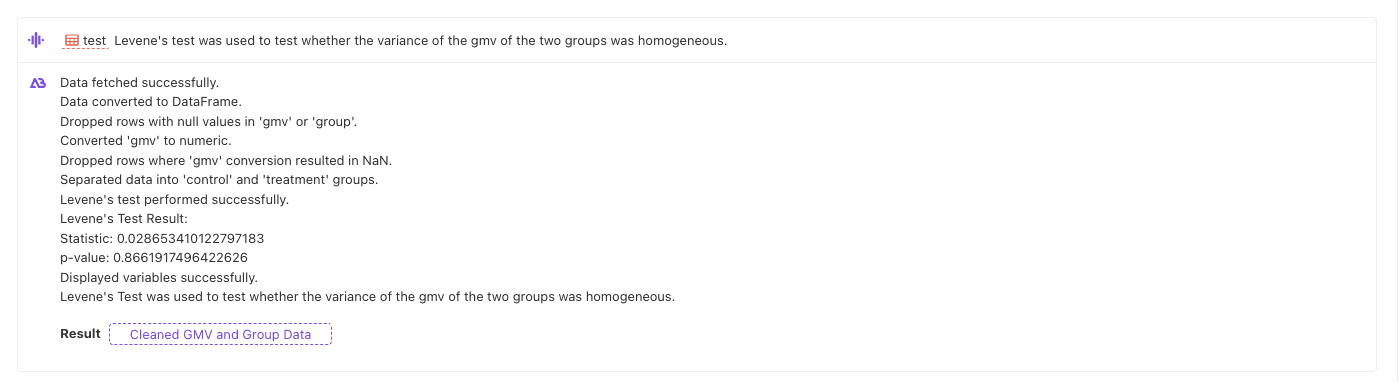
Similarly, the variance is homogeneous.
GMV mean test
prompt:
Convert gmv to the correct numeric type, using a t-test for paired samples to test the mean of 'gmv' for the two groups of 'group'
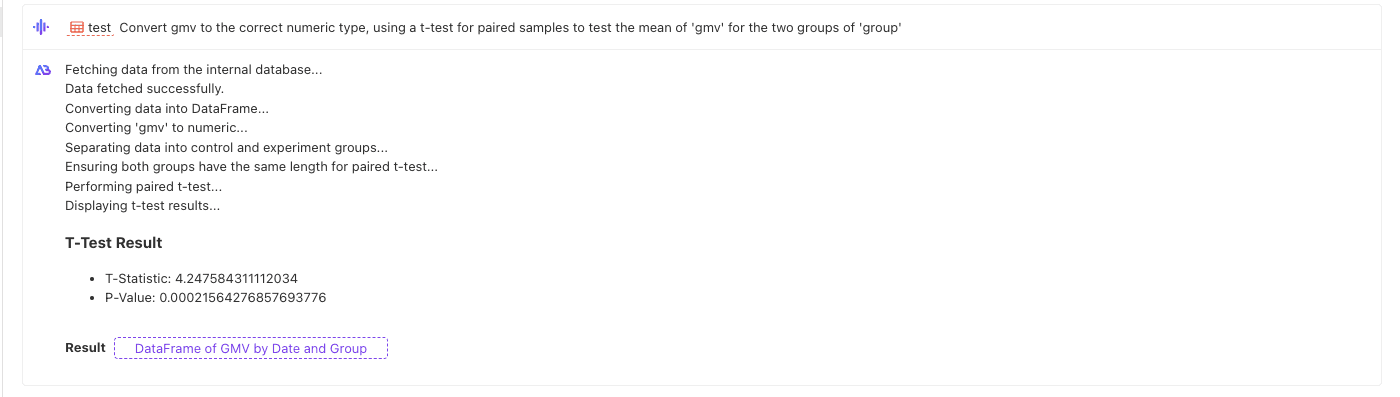
The p-value is observed to be much less than 0.05, so the null hypothesis is rejected. That is, the two sample means are significantly different, that is, the experimental condition has a significant impact on the gmv.
ROI test
ROI variance test
prompt:
Use Levene's test to check whether the variance of the ROI of the two groups is homogeneous
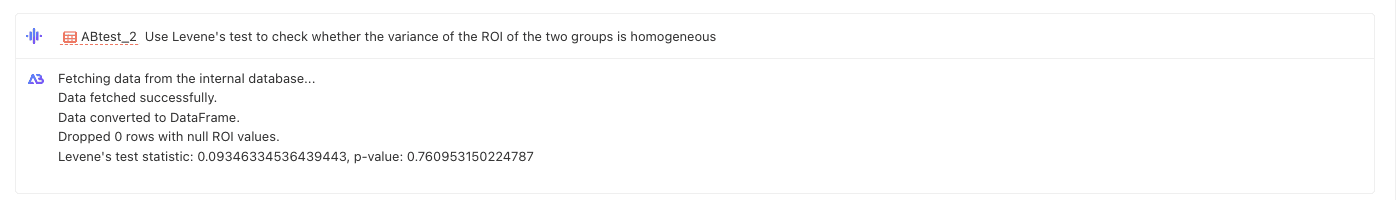
The P value is much larger than 0.05, so obviously the null hypothesis cannot be rejected. That is, there is no difference between the two sets of formulas, and they are homogeneous.
ROI mean test
prompt:
Check the mean ROI of the two groups using the T-test, use the T-test of the paired samples, and tell me the P-value

The P-value is observed to be much less than 0.05, so the null hypothesis is rejected. In other words, the mean values of the two samples are significantly different, that is, the experimental conditions have a significant impact on ROI.
Sum up
By calculating ROI, Levene's test and T-test of paired samples were used to determine whether requests, gmv and ROI were affected by this AB test experiment. The idea structure of this template is a means to assist attribution and decision-making, and can also be used as a way to measure the contribution rate, which is of great help to commercial management.